The Chrome extension is the fastest way for your team to send a browser problem to Disbug. If you are not sure that the extension fits your reporters, read [Choose how to report a bug](/choose-how-to-report-a-bug-67fae73d) first.
## Install the extension
1. Sign in at [app.disbug.io](https://app.disbug.io/).
2. Install [Disbug from the Chrome Web Store](https://chromewebstore.google.com/detail/disbug-superior-bug-repor/ikogehheclkeaipcngkhdpnmfhjhpdio).
3. Open the Chrome **Extensions** menu.
4. Pin **Disbug** to the toolbar.
Disbug supports Chrome 116 or later.
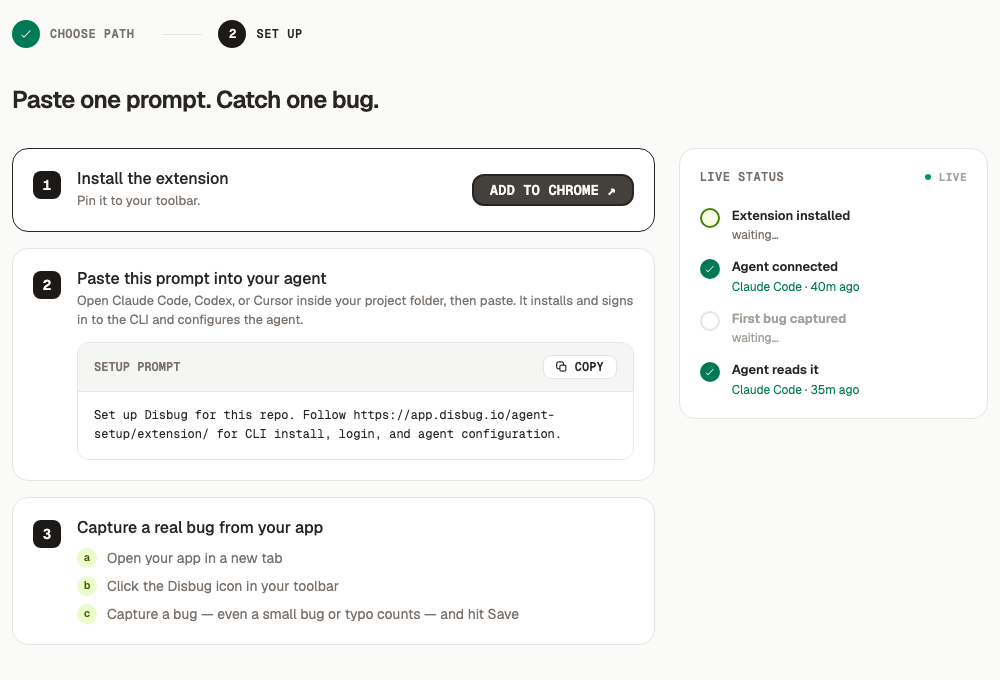
The setup page in the Disbug app also links to the Chrome Web Store with **Add to Chrome**. Its live status list shows when the extension, a coding agent, and your first report are ready.
## Open the problem page
Open the affected page in a normal browser tab. Select the Disbug icon.
On first use for a site, Disbug asks about diagnostics. Turn on diagnostics when logs or recent actions can help a developer. You can continue without them. [Capture hard-to-reproduce bugs](/capture-hard-to-reproduce-bugs-3986142f) explains what diagnostics collect.
Capture starts after you turn on diagnostics. Disbug cannot recover earlier activity.
## Add the first pin
1. Select the page element that has the problem.
2. Describe the expected result.
3. Describe the actual result.
4. Add a condition that causes the problem, if you know it.
5. Select **Add pin**.
Example: **The Pay button must complete the order. It shows a loading state and returns to the same page.**
Add more pins only when they belong to the same user task or reproduction. [Use pins, screenshots, and voice feedback](/use-pins-screenshots-and-voice-feedback-d28525a9) explains when to add more pins.
## Save the report
1. Select **Save**.
2. Examine the included pins.
3. Enter or examine the report title.
4. Select a project if Disbug shows more than one.
5. Select **Save**.
Disbug saves the report and tries to copy its link. Share the link with a teammate who belongs to the same Disbug team. See [Collaborate and merge duplicate reports](/collaborate-and-merge-duplicate-reports-98da5a26) for how teammates work on a shared report.
If a screenshot fails, retry when Disbug offers the option. You can also save the other evidence without that screenshot.
## If the extension does not work
- Sign in to `app.disbug.io` in the same Chrome profile.
- Reload the page after you install the extension.
- Use a normal website. Chrome blocks extensions on some browser and store pages.
- Wait for projects to load before you save.
## Next step
- [Connect a coding agent and watch for reports](/connect-a-coding-agent-and-watch-for-reports-87cb32a4) so your agent can read the report.
- [Review, assign, and resolve reports](/review-assign-and-resolve-reports-a27650f8) to see the saved report in the app.
- [Capture hard-to-reproduce bugs](/capture-hard-to-reproduce-bugs-3986142f) to add logs, replay, or a recording.
Install the extension and report your first bug
The Chrome extension is the fastest way for your team to send a browser problem to Disbug. If you are not sure that the extension fits your reporters, read Choose how to report a bug first.
The setup page in the Disbug app also links to the Chrome Web Store with Add to Chrome. Its live status list shows when the extension, a coding agent, and your first report are ready.
Open the affected page in a normal browser tab. Select the Disbug icon.
On first use for a site, Disbug asks about diagnostics. Turn on diagnostics when logs or recent actions can help a developer. You can continue without them. Capture hard-to-reproduce bugs explains what diagnostics collect.
Capture starts after you turn on diagnostics. Disbug cannot recover earlier activity.
Disbug saves the report and tries to copy its link. Share the link with a teammate who belongs to the same Disbug team. See Collaborate and merge duplicate reports for how teammates work on a shared report.
If a screenshot fails, retry when Disbug offers the option. You can also save the other evidence without that screenshot.
