Jam Alternative: Disbug for Agent-Ready Bug Reports
Jam and Disbug are both built around the moment a browser problem needs to be explained. The difference is what happens after the capture. Jam is built around making a useful recording easy to share. Disbug is built around turning the browser session into structured evidence that a coding agent can inspect.
Neither tool is the right choice for every team. If you want a polished recording and a link you can send to a teammate, Jam deserves a close look. If the next step is handing the report to Claude Code, Codex, or Cursor to investigate the code behind the failure, Disbug takes a different approach.
What Jam is and what it does well
Jam is a browser bug-capture and feedback tool. It lets someone record what happened in a browser and share the result with other people. That focus is valuable: the reporter can show the problem in context instead of trying to describe every click from memory.
Jam’s strongest quality is its developer-friendly recording experience. A short recording can communicate the visible symptom, the actions that led to it, and the point where the behavior went wrong. That makes Jam a natural fit for developers, designers, QA testers, and clients who need to send one another a clear visual explanation.
Jam also has capabilities beyond the recording itself. Its plans include recording links, AI summaries, backend logging on the Team plan, integrations, and MCP support. Jam already ships MCP, so teams that want their agent tooling to discover Jam context through that protocol should count it as a current Jam capability. MCP alone is not the deciding difference here; the evidence payload is.
The tradeoff is one of emphasis. A recording is excellent evidence for a person reviewing the issue, but a coding agent may need more than a video or a summary. It may need to correlate the visible failure with a console exception, a failed request, a DOM selector, and the exact event sequence. That is the problem Disbug is designed to address.
Jam pricing as of 2026-08-04
The following Jam prices and limits were verified against its official pricing information on 2026-08-04:
- Free: $0, with 30 Jams, 5 recording links, and recordings up to 5 minutes. The plan includes integrations and MCP.
- Team: $14 per creator per month when billed annually. It includes unlimited Jams, 150 recording links, recordings up to 15 minutes, 200 AI summaries, and backend logging.
- Enterprise: Custom pricing.
Because Team is priced per creator, compare it with the number of people who record, not everyone who only views reports. The Free plan is a practical way to evaluate Jam’s recording workflow.
Where Disbug differs
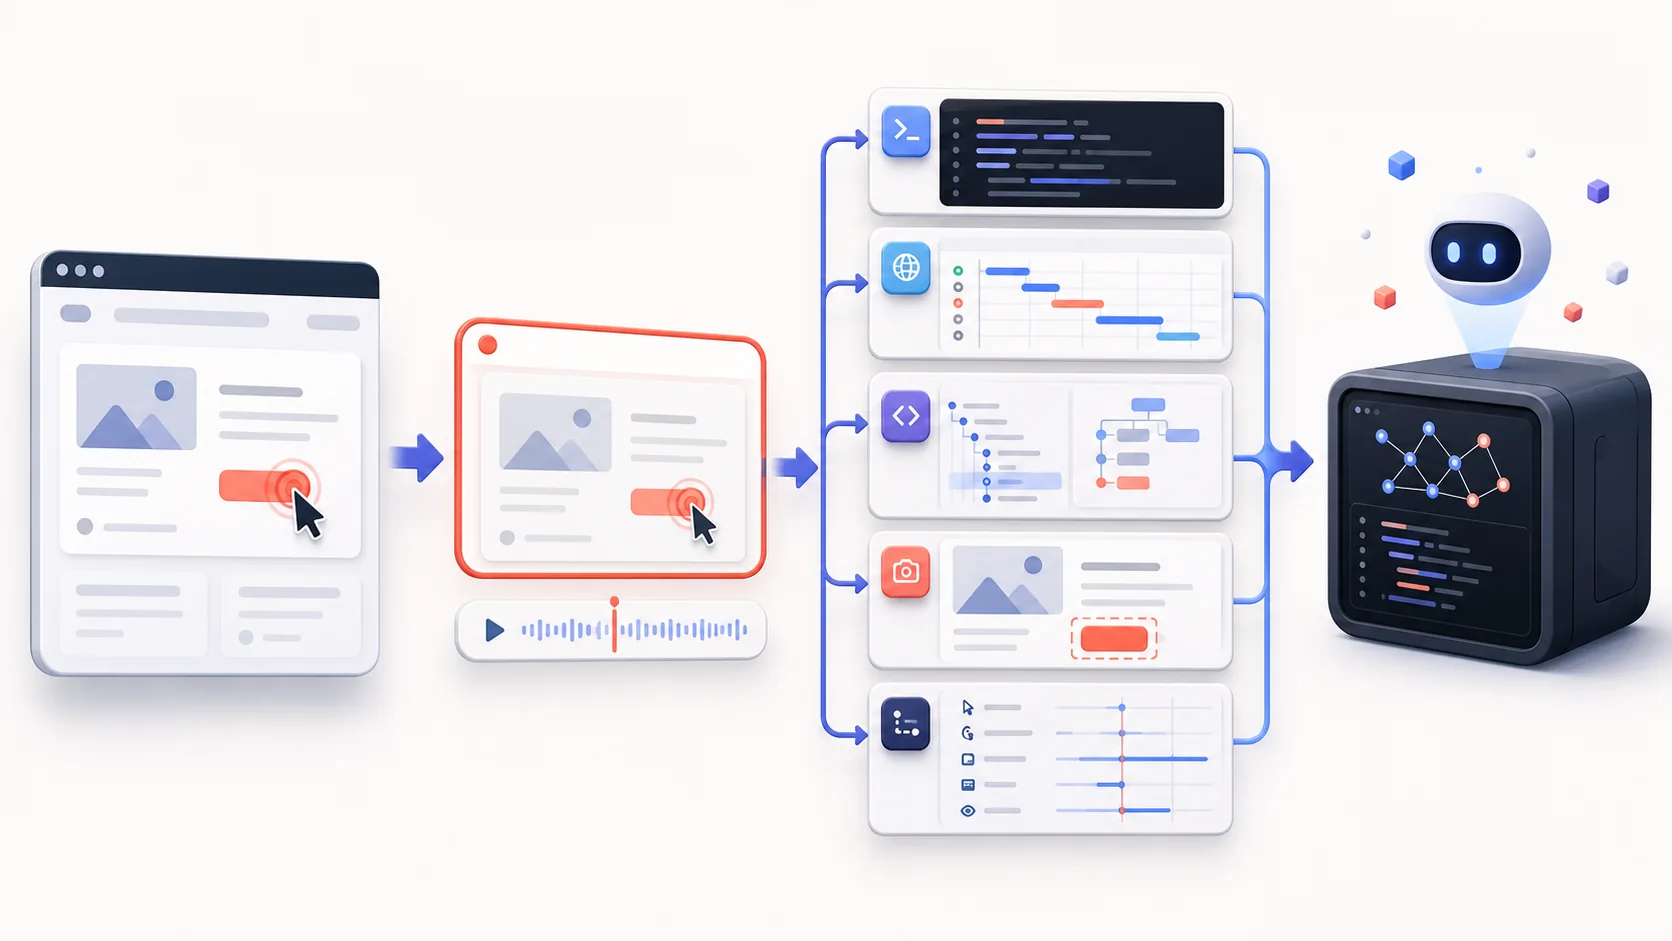
Disbug treats a browser bug as a set of connected observations rather than a single recording. A report can include the screen recording or session replay, a screenshot of the relevant moment, the reporter’s description, and reproduction steps. It can also preserve the user-event trail that led to the failure, so the report shows what the person did as well as what they saw.
The technical evidence is structured for inspection. Console entries can carry the log type, timestamp, value, and page URL. Network entries can carry the request or response status, HTTP method, full URL, timing, headers, and body data where it is captured, subject to redaction and truncation rules. Browser metadata records the environment around the report, including the browser, operating system, viewport, and timestamp.
Disbug also keeps the page context around the interaction. The report can identify the selected element with its selector and element metadata, while the replay preserves the relevant DOM state and changes around the interaction. This gives an agent more to work with than the sentence “the button does not work” or a video that requires manual inspection.
That does not make every report better by definition. A recording may be enough for a human teammate; Disbug is useful when the report must become a working input for technical investigation.
What a coding agent does with the evidence
When you give a Disbug report to a coding agent, the agent can start from observations instead of guessing. It can read the reproduction steps and user-event sequence, inspect the screenshot or replay at the failure point, and use the selector and page URL to identify the relevant screen or component in the codebase.
It can then compare the visible symptom with the console and network evidence. For example, a console error may point to a JavaScript path, while a failed network request may reveal the endpoint, method, status, and timing involved. The agent can use those clues to narrow the search, inspect the relevant code, propose a change, run the project’s tests, and ask for a fresh verification when the fix needs to be checked in the browser.
That is the boundary between the two products. Disbug captures and organizes what happened. The coding agent reasons about the code and, when you ask it to, makes and tests a change. Disbug does not fix bugs itself, and it does not replace the judgment of the person reviewing the proposed fix.
Choose Jam if…
- You want a recording-first workflow that makes browser problems easy to show and share.
- Your reports are usually reviewed by people, and a short visual explanation is enough to start the conversation.
- Jam’s integrations, AI summaries, backend logging, or MCP support fit the workflow you already use.
- The Free or Team plan limits match the number of recordings and links your team needs.
Jam genuinely wins these cases. Its product is focused, and its plans give teams a clear way to try the workflow before committing to Enterprise.
Choose Disbug if…
- The report is going to a coding agent as part of the debugging process.
- You need the visual symptom tied to console logs, network requests, DOM context, metadata, and reproduction evidence.
- You want an agent to inspect a bounded evidence payload, trace a failure toward a code path, and then work through a fix-and-test cycle with human oversight.
- Your priority is the quality and structure of the captured context, even when a simple recording link would be enough for someone else.
Disbug is not a promise that an agent will always find the cause. It gives the agent a more complete account of the browser state and actions that produced the problem. The agent still needs access to the codebase, appropriate permissions, and a human decision about what should change.
How integrations fit into the workflow
Disbug integrations connect captured browser evidence to the project and communication tools a team already uses. The integration handles the handoff; Disbug remains focused on capturing the recording, console and network logs, DOM context, metadata, and reproduction evidence that help a developer or coding agent investigate the failure.
The bottom line
Choose Jam when a fast, shareable browser recording is the center of your workflow. Choose Disbug when the recording is only one part of the handoff and your coding agent needs the surrounding evidence to investigate what actually happened. Both approaches are valid; the better fit depends on what your team needs to do after the bug is captured.
If you want to give your coding agent structured browser evidence, sign up for Disbug.